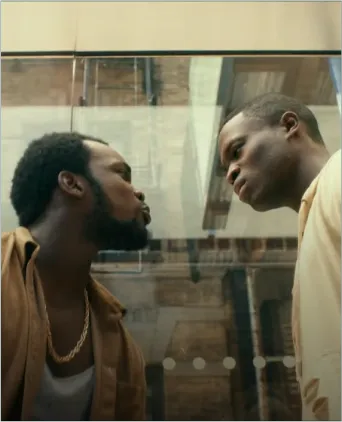
Representation
in the Film Industry
Filmmakers write about people and places they know –
so their unconscious bias gets baked into the content and the casting of roles.
Entertainment shapes what we think of ourselves and other people.
As the Geena Davis Institute puts it:
As the Geena Davis Institute puts it:
“If she can see it, she can be it.”
– Geena Davis Institute
Executive Overview

Men speak twice as often as women on screen.

Disabled people are shown 10 times less on screen than in reality.

Latinos are 3x under-represented in U.S. Movies&TV
LGBTQ+ exist a third less on screen than in the US.
Data from 2017
Representation in the Film & TV Industries
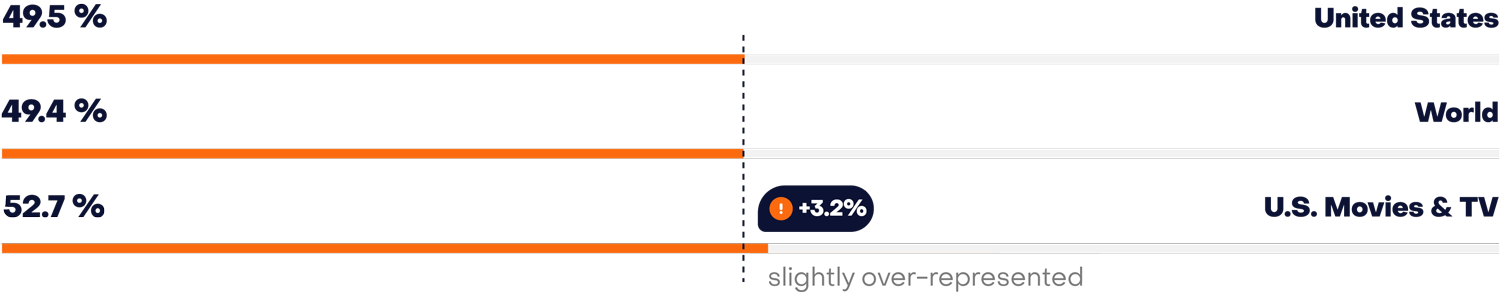
Sex
52.7% male
In only 4 years, sex/gender representation in speaking roles has come close to being representative of the population - a testament to industry commitment for representation being effective.
2020
Female
Source: USC Annenberg (2020), census.gov, World Bank
Male
Source: USC Annenberg (2020), census.gov, World Bank
Race & Ethnicity
More representative
On the race and ethnicity side, things have also gotten a lot more representative in the past 4 years. New frontiers of representation are in lead characters, and non-stereotypical representation.
2020
White (Non-Hispanic)
Source: UCLA Hollywood Diversity Report 2022, census.gov

Latino / Hispanic
Source: UCLA Hollywood Diversity Report 2022, census.gov

Black / African American
Source: UCLA Hollywood Diversity Report 2022, census.gov

Asian
Source: UCLA Hollywood Diversity Report 2022, census.gov

Other
Source: UCLA Hollywood Diversity Report 2022, census.gov

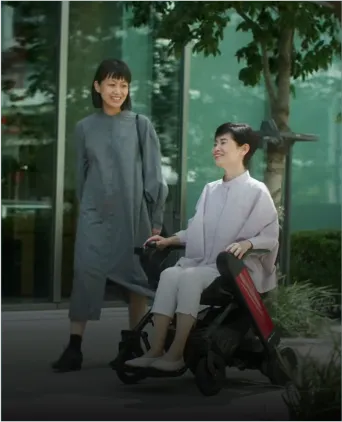
Disability
Near parity
Disability on screen has also seen a significant growth of representation, very close to parity. The next frontier is in casting disabled characters with actors who actually have that disability.
2020
One in five US-Americans has a disability.
There are more than 1 Billion people globally with a disability.
People with disability
Source: CDC.gov (2014), WHO.int (2011), Geena Davis Institute on Gender in Media (TV, 2021 Report)
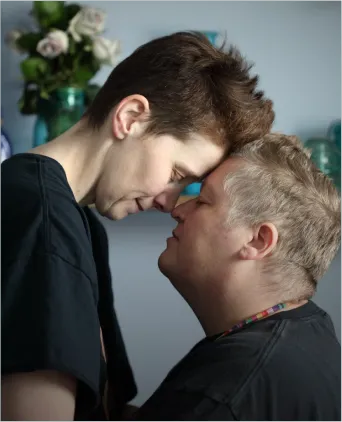
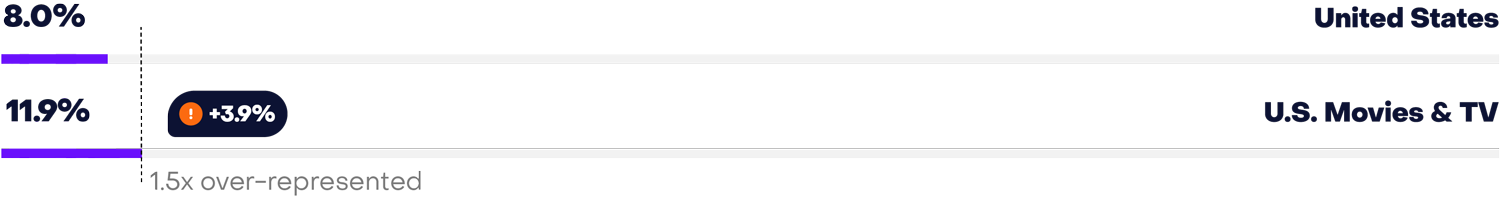
LGBTQ+
2021
1.5x more LGBTQ characters
92 out of 775 TV & streaming series regular characters were LGBTQ+. That’s 1.5x of the U.S. average, a significant increase and over-representation.
40% of these LGBTQ+ characters were lesbian women. Primetime Television “over-represents” significantly at this point.
About 20 Million U.S. Americans identify as LGBTQ+ as of 2021.
LGBTQ+ People
Source: HRC Foundation Report (2021), GLAAD'S Where We Are on TV Report (2021-2022)
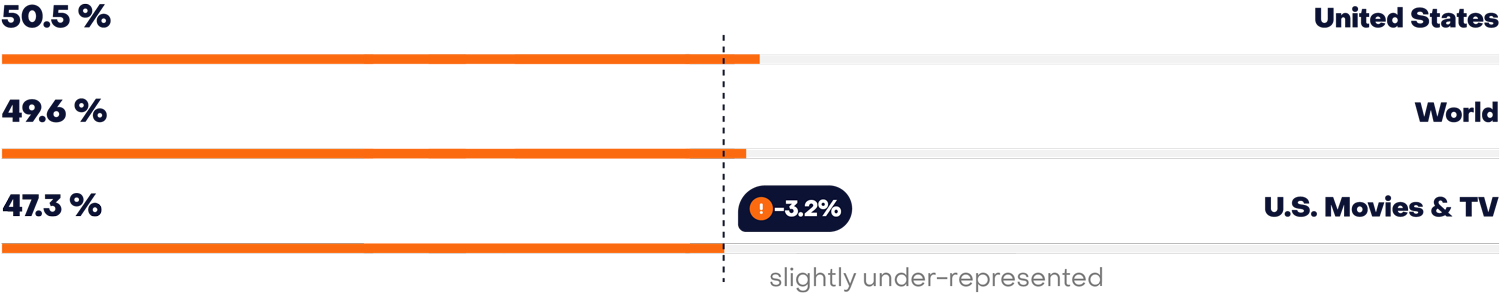
Sex
67% male
For every 1 female speaking role, there are 2 male speaking roles – far from 50:50
2016
Female
Source: Census.gov (2016), UN.org, USC Annenberg (2016)

Male
Source: Census.gov (2016), UN.org, USC Annenberg (2016)

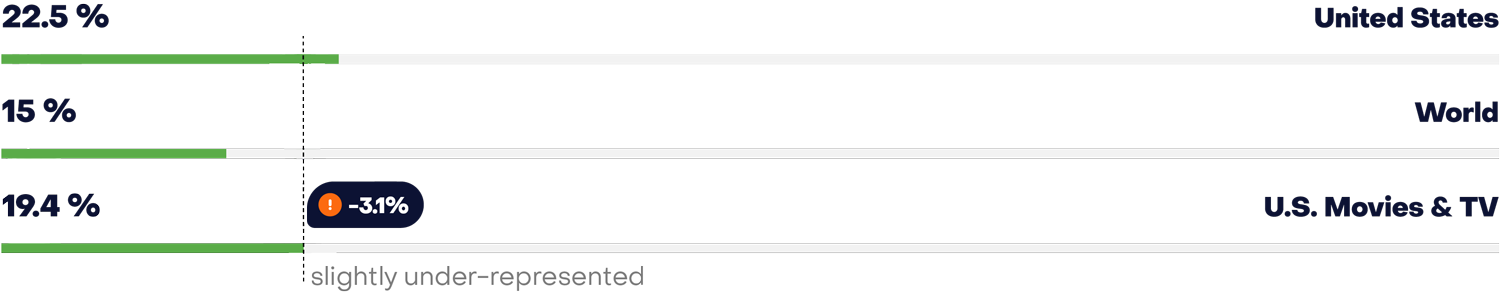
Race & Ethnicity
×3 less latinos
White people are 10% over-represented while Latino people are 3x under-represented compared to the U.S. population
2016
White (Non-Hispanic)
Source: Census.gov (2016), UN.org, USC Annenberg (2016)

Latino / Hispanic
Source: Census.gov (2016), UN.org, USC Annenberg (2016)

Black / African American
Source: Census.gov (2016), UN.org, USC Annenberg (2016)

Asian
Source: Census.gov (2016), UN.org, USC Annenberg (2016)

Other
Source: Census.gov (2016), UN.org, USC Annenberg (2016)

Disability
×10 under-represented
Disability on screen is 10x under-represented when compared to the real world.
One in five US-Americans has a disability.
There are more than 1 Billion people with disability.
2016
People with disability
Source: Census.gov (2016), UN.org, USC Annenberg (2016)

LGBTQ+
229 LGBTQ characters
229 out of 11,194 Movie & TV characters were LGBTQ+. That’s half of the U.S. average.
About 80% of these LGBTQ+ characters were white men. Primetime Television “over-represents” with 6.5% LGBTQ+ characters.
About 10 Million U.S. Americans identify as LGBTQ+.
2016
LGBTQ+ People
Source: Census.gov (2016), UN.org, USC Annenberg (2016)

Representation at Prodigium
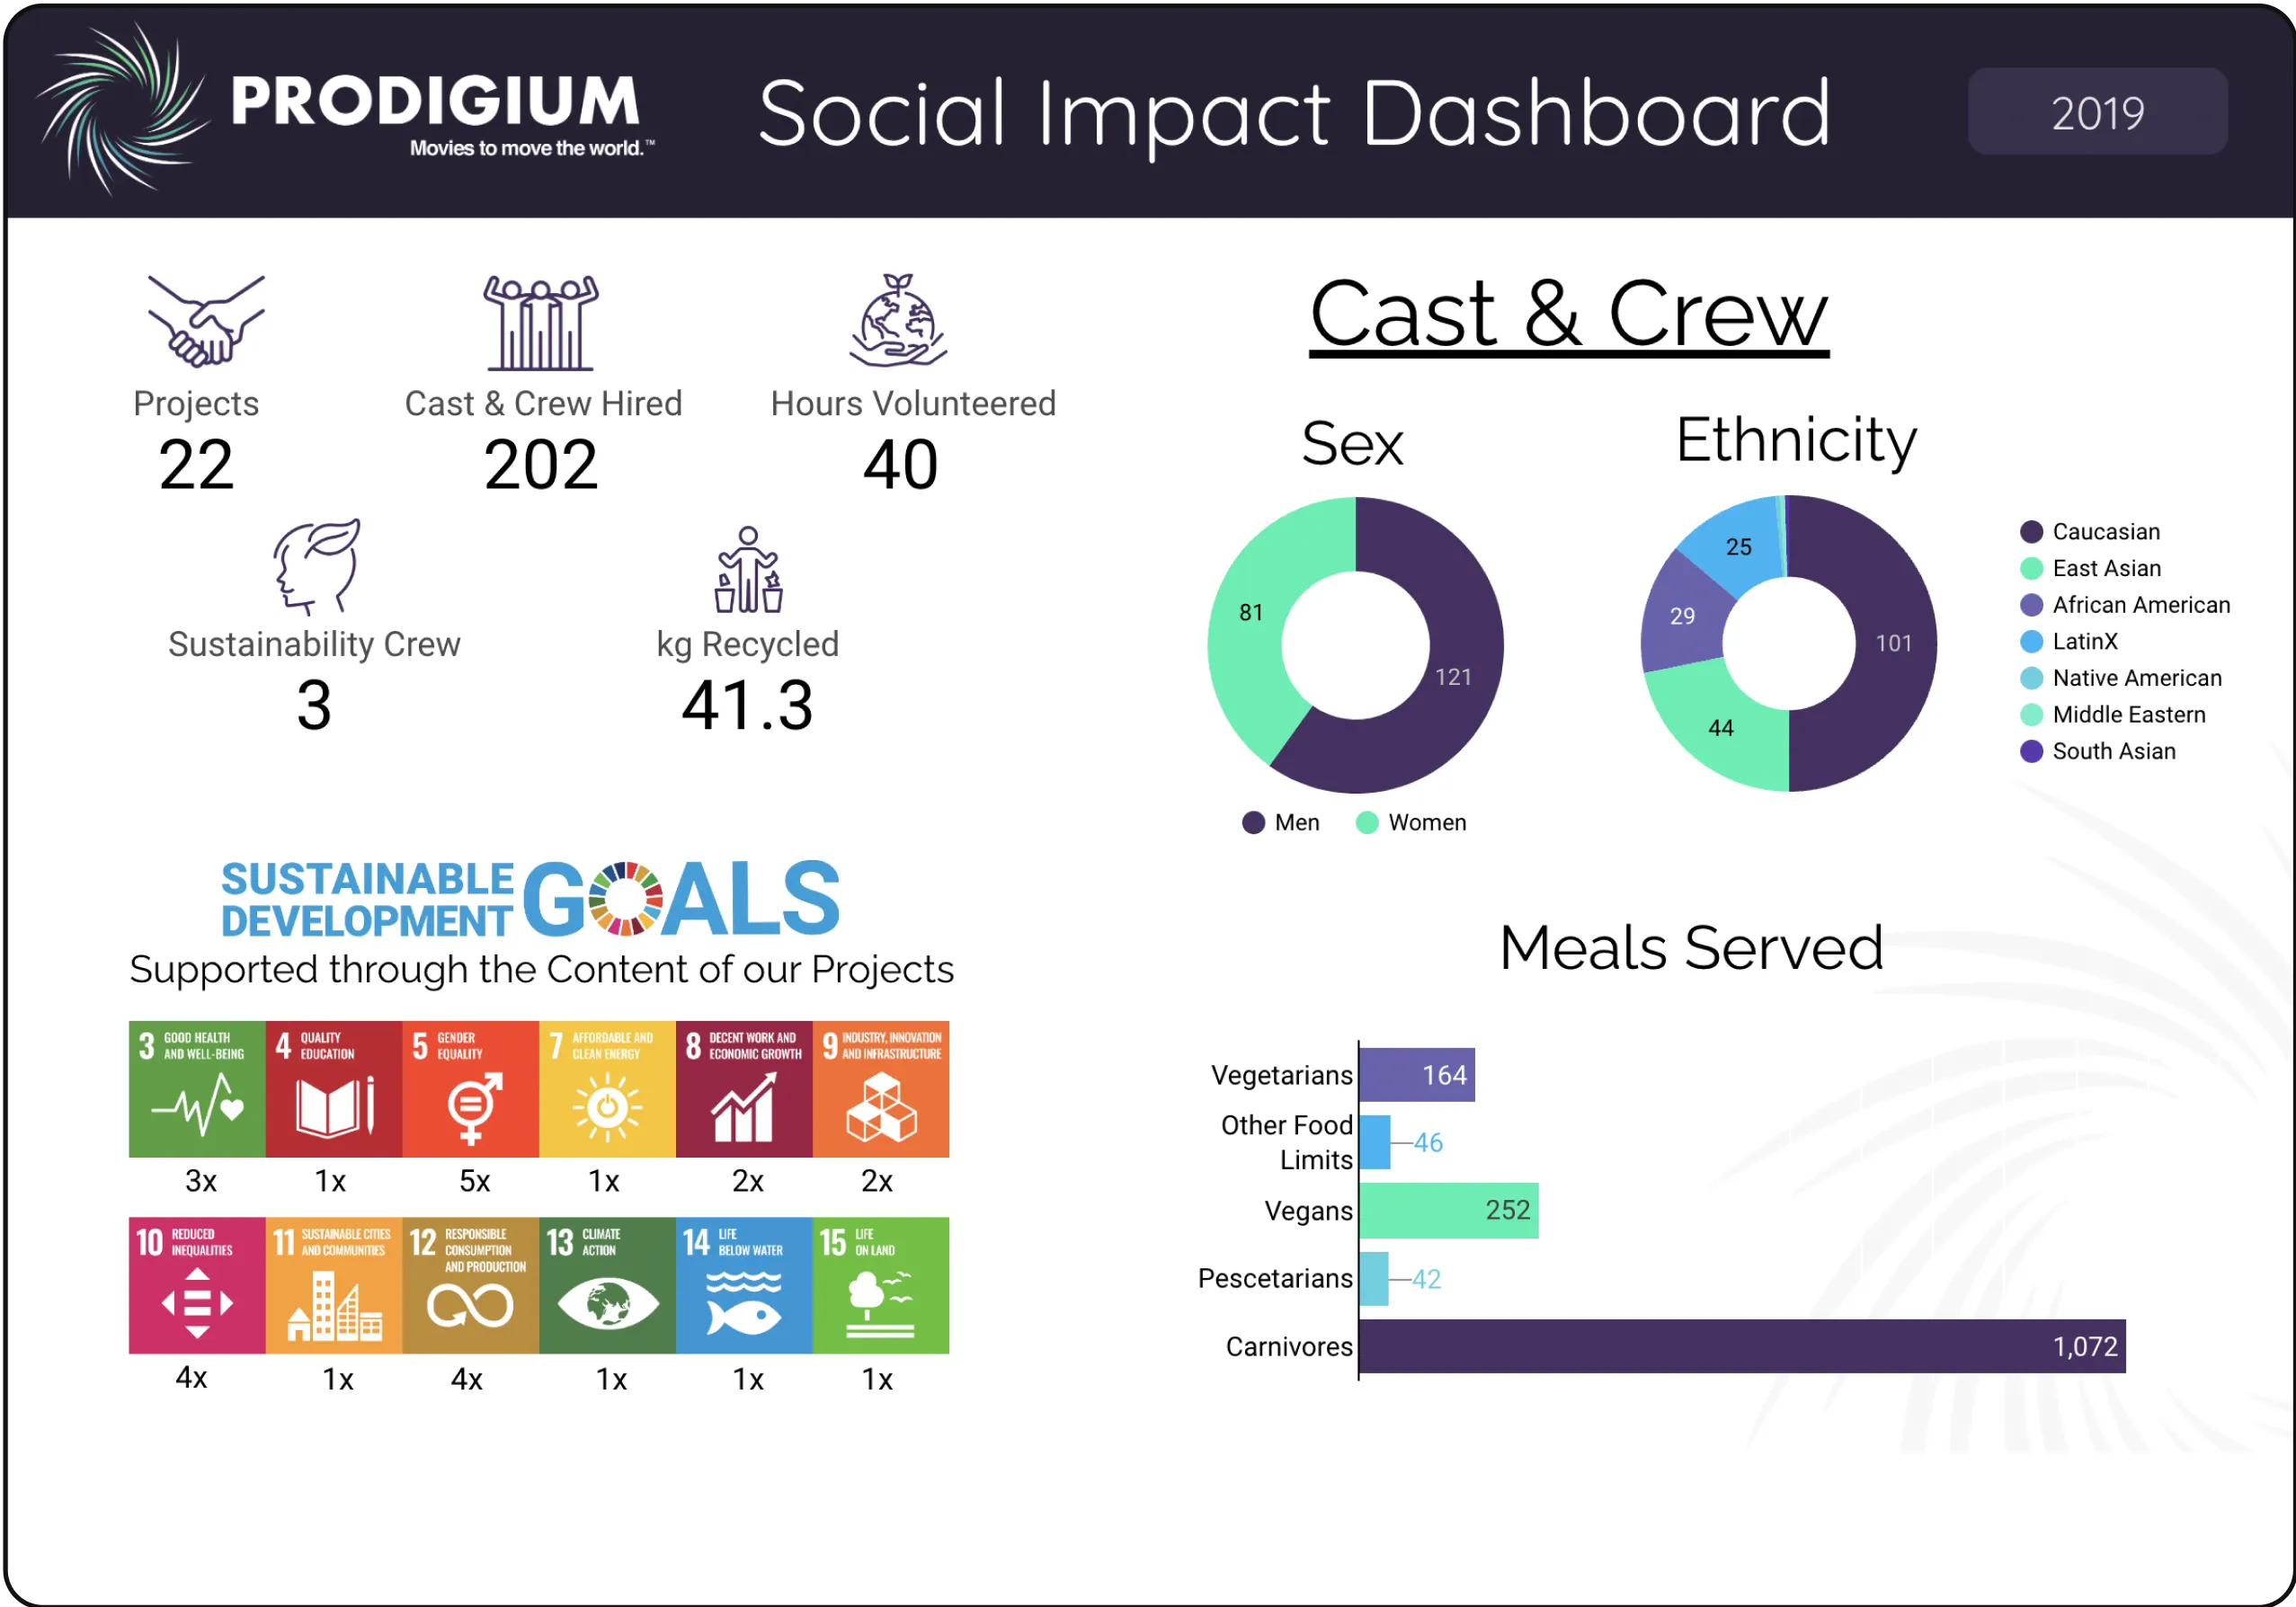

Unique projects
Unique projects
with something
with something
to say.
to say.
Impact that
Impact that
the initial buzz.
the initial buzz.
Authentic
Authentic
connections
connections
with your
with your
audience.
audience.
Since 2011, we’ve
Since 2011, we’ve
continuously made an effort
continuously made an effort
to measure our impact,
to measure our impact,
and with above dashboard
and with above dashboard
it is finally accessible
it is finally accessible
to the public.
to the public.


Let’s make something
great together...
Choose a topic below to get in touch with us:
Let’s make something
great together...
Thank you! Your submission has been received!
Oops! Something went wrong while submitting the form.
Let’s make something
great together...
Thank you! Your submission has been received!
Oops! Something went wrong while submitting the form.
Let’s make something
great together...
Thank you! Your submission has been received!
Oops! Something went wrong while submitting the form.